


 45 / 218

AIR PRODUCTION AND PREPARATION
Pipe size calculations
There are two methods, which can be used to regulate the correct internal diameter of the primary pipe-work.
Analytical
: this accounts for the consumption at each point of use and the losses due to pressure drop for each
length of pipe. This is an accurate and thoroughmethod, but also time consuming.
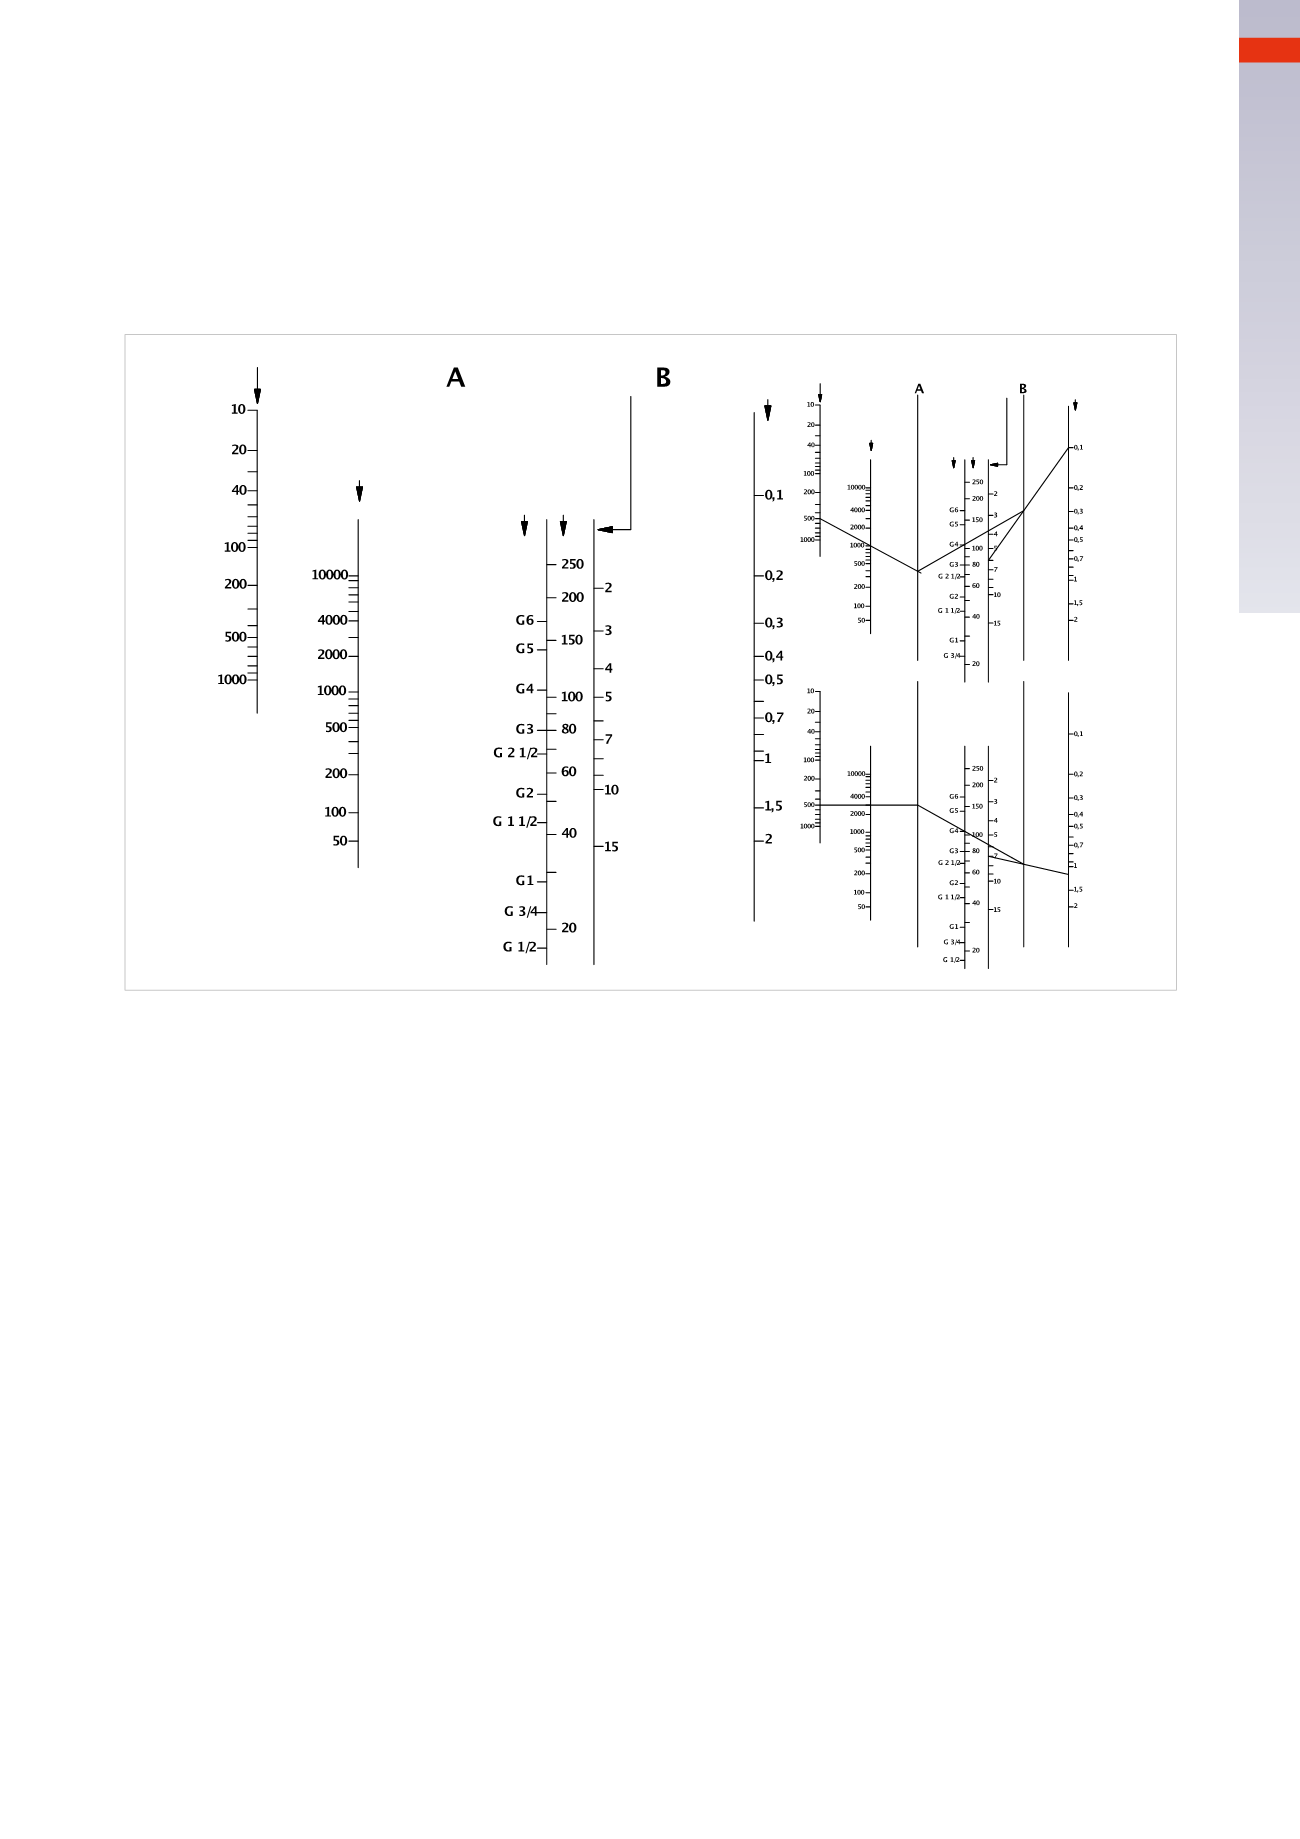
Graphical
: simple and practical, thismethod employs aNomogram displaying each of the dimensions required to
establish the correct size. The axis displaying pipe diameters is dual scaled in that it shows gas sizes in inches and
millimetres, for the direct reading of the value:
How to use theNomogram:
Total pipe length
inmetres
Pressurebar
Pressure
dropbar
Tubediameter
External
GAS
Internal
mm
Flow
Nm
3
/h
Totalpipe length
inmetres
Pressurebar
Pressure
dropbar
Tubediameter
External
GAS
Internal
mm
Flow
Nm
3
/h
Fig. 9
Example 1:
determine the internal diameter of a primary network, in a distribution network with the following
characteristics:
total pipe length
500
m
maximum capacity
1000
Nm
3
/h
operating pressure 6
bar
pressure drop allowed
∆
p
0,1
bar
Identify the value of length and flow rate on the respective axis.
Join the identified points and extend the line until the
A
axis.
Identify the value of the pressure and
∆
p
.
Join the two points with a line.
Join the two points established by the intersections on axis
A
and
B
. The required dimension will be established
by the point where the line between axis
A
and axis
B
crosses the pipe size axis.
With these parameters, the value corresponds to the value
G4
.
Example 2:
examine the pressure drop in the same network by replacing the compressor with another compressor
with three times the capacity andwith a pressure of 7
bar
.
Identify the value of the length and the flow rate on their respective axes.
Join the identified points and extend the line until axis
A
.
Join the point on axis
A
with the
G4
point and extend the line to axis
B
.
Draw a line from the 7
bar
point that passes through the intersection between axis
A
and axis
B
and extend it to
the “pressure drop” axis.
With these parameters,
∆
p
is greater than 1
bar
.
Note
: the nomogram does not take into account the pressure drop of the fittings, valves, and any corners/curves
included in the primary distribution network.
2
43
CAMOZZI
>
AIRPRODUCTIONANDPREPARATION